Foodfindr - Your guide to local, healthy dining in Boston
March 01, 2016To help with the transition from academia to data science, I participated in the inaugural session of the Insight Health Data Science program in Boston, MA back in July 2015. As part of the program, the first four weeks are spent creating a data science project that typically comes in the form of an interactive web application on a (health-related) topic of your choosing. After going through a few ideas in my head, I decided to focus on a project that would give me some NLP/webscraping experience, and (arguably more importantly) get me acquainted with the massive number of restaurants in the Greater Boston area.
Given that the focus of Insight was on health, I wanted to come up with a way to try and identify which restaurants in town are healthier than others purely based on the text found in the menu. Now, this isn’t a trivial problem as restaurants rarely release information regarding the caloric content or relative portion sizes of their dishes. Additionally, many restaurants publish their menus on their website in a non-standard pdf format.
After some research, I ultimately decided on using the following workflow:
- Scrape Boston menus (N = 2,158) using Python and BeautifulSoup from menupages.com and create a bag of (food) words
- Assign hard labels of healthy and non-healthy using the menupages restaurant tags with a naive, rule-based method (salads, vegan, vegetarian-friendly, and [sandwiches and not pizza] were tagged as healthy restaurants)
- Build/tune a random forest classifier using the bag of words to predict these labels
- Categorize the predicted probabilities into low (1st quartile - red), medium (2nd and 3rd quartiles - yellow), and high (4th quartile - green)
- Create an interactive web application using R and Shiny, and deploy to an AWS instance
Given that the notion of health was itself dependent upon the assumptions I made with assigning labels, validation of results was key. First, I calculated AUC as a measure of internal validation using 5-fold cross-validation. The image of the ROC curve can be seen below:

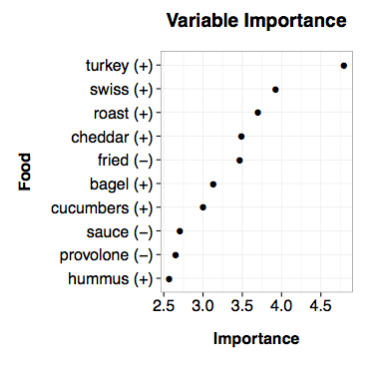
In addition to internal validation, I also performed external validation in three ways. The first was to look at variable importance and partial dependence plots of the top predictors to ensure they made intuitive sense. They did, with words like turkey, cucumber, and hummus having high predictive power in a positive direction, and words like fried, sauce, and provolone having high predictive power in a negative direction. A variable importance plot of the most important food words can be seen below:

The second was to identify if clusters of unhealthy restaurants existed in areas one would expect. Sure enough, both Chinatown and the North End were covered in red restaurants. Finally, the third was to manually curate a list of recommended healthy restaurants using local Boston food blogs. From three blogs I found 30 recommended restaurants, of which my app classified 19 as “green” and 11 as “yellow” with no “red”. The final project, which I called foodfindr, can be seen on my shinyapps dashboard.
The most difficult part of this project was trying to come up with a way to label restaurants as healthy/not healthy for the purposes of training the model. I actually first tried a simple scoring method by trying to come up with a overall health score for each unique food word based on its nutritional properties for a single serving using a nutrition website API. I also tried an unsupervised approach by clustering the bag of words into distinct groups, which I would then label by hand. Both approaches gave nonsensical results and I ultimately went with the workflow outlined above.
In addition to the color ratings of restaurants, some additional features of the app allow a user to narrow their search by a certain walking distance (as the crow flies), a given price-range, and restaurants that have vegan, vegetarian-friendly, or gluten-free options. If I had more time, I think a really cool feature to add on would be a healthy restaurant recommender that could take a user’s favorite restaurant and recommend other healthy alternatives that possess a similar menu. Because I used a random forest, this could be done by using the resulting proximity matrix as a measure of distance among the observations conditional on the bag-of-words features.
All in all, I had a blast at Insight working on this project and the companies I demonstrated the app to seemed to get a kick out of it as well. If you’re interested in learning more, the slides I used for my demo are on the site, and the relevant code and data for this application can be seen on GitHub.
